Black Friday report card
How did you really perform last Black Friday? Enter your key performance metrics into the fields below and understand what went well, what needs improvement and a clear focus for next year’s Black Friday period.
Tell us about your last Black Friday period
Total sales across the weekend, after discounts and before returns.
Margin after COGS, shipping and fees, before any discount. Only know your gross margin? Use it and read the result as a best case.
The typical markdown you ran across the weekend.
Everything you spent on paid acquisition.
Share of revenue from first-time buyers.
Roughly what share of sales came back as returns. Set to 0 to ignore.
Estimated contribution
Your Black Friday cleared about €9,600 in gross contribution.
That’s what was left after 25% off, 10% returns and €12,000 in ad spend, before fixed costs.
- Discount discipline
- B
- Ad efficiencyblended
- A
- Acquisition quality
- B
25% off ate 45% of your 55% margin, so you needed 83% more sales just to match a normal-price weekend.
Blended ROAS of 4.5× against a 2.5× break-even: comfortably clear of it, but blended ROAS counts returning and organic sales, so your paid-only number is lower.
40% of revenue came from new customers, around the typical Black Friday mix. Winning them back at full price is what turns the discount into a real acquisition cost worth paying.
Focus here next time: discount discipline.
Estimates only, based on the numbers you enter. Contribution is gross of fixed costs and tax, and uses blended ROAS across all revenue, which flatters paid performance. Returns are deducted at the rate you enter; retention and lifetime value aren't measured here.
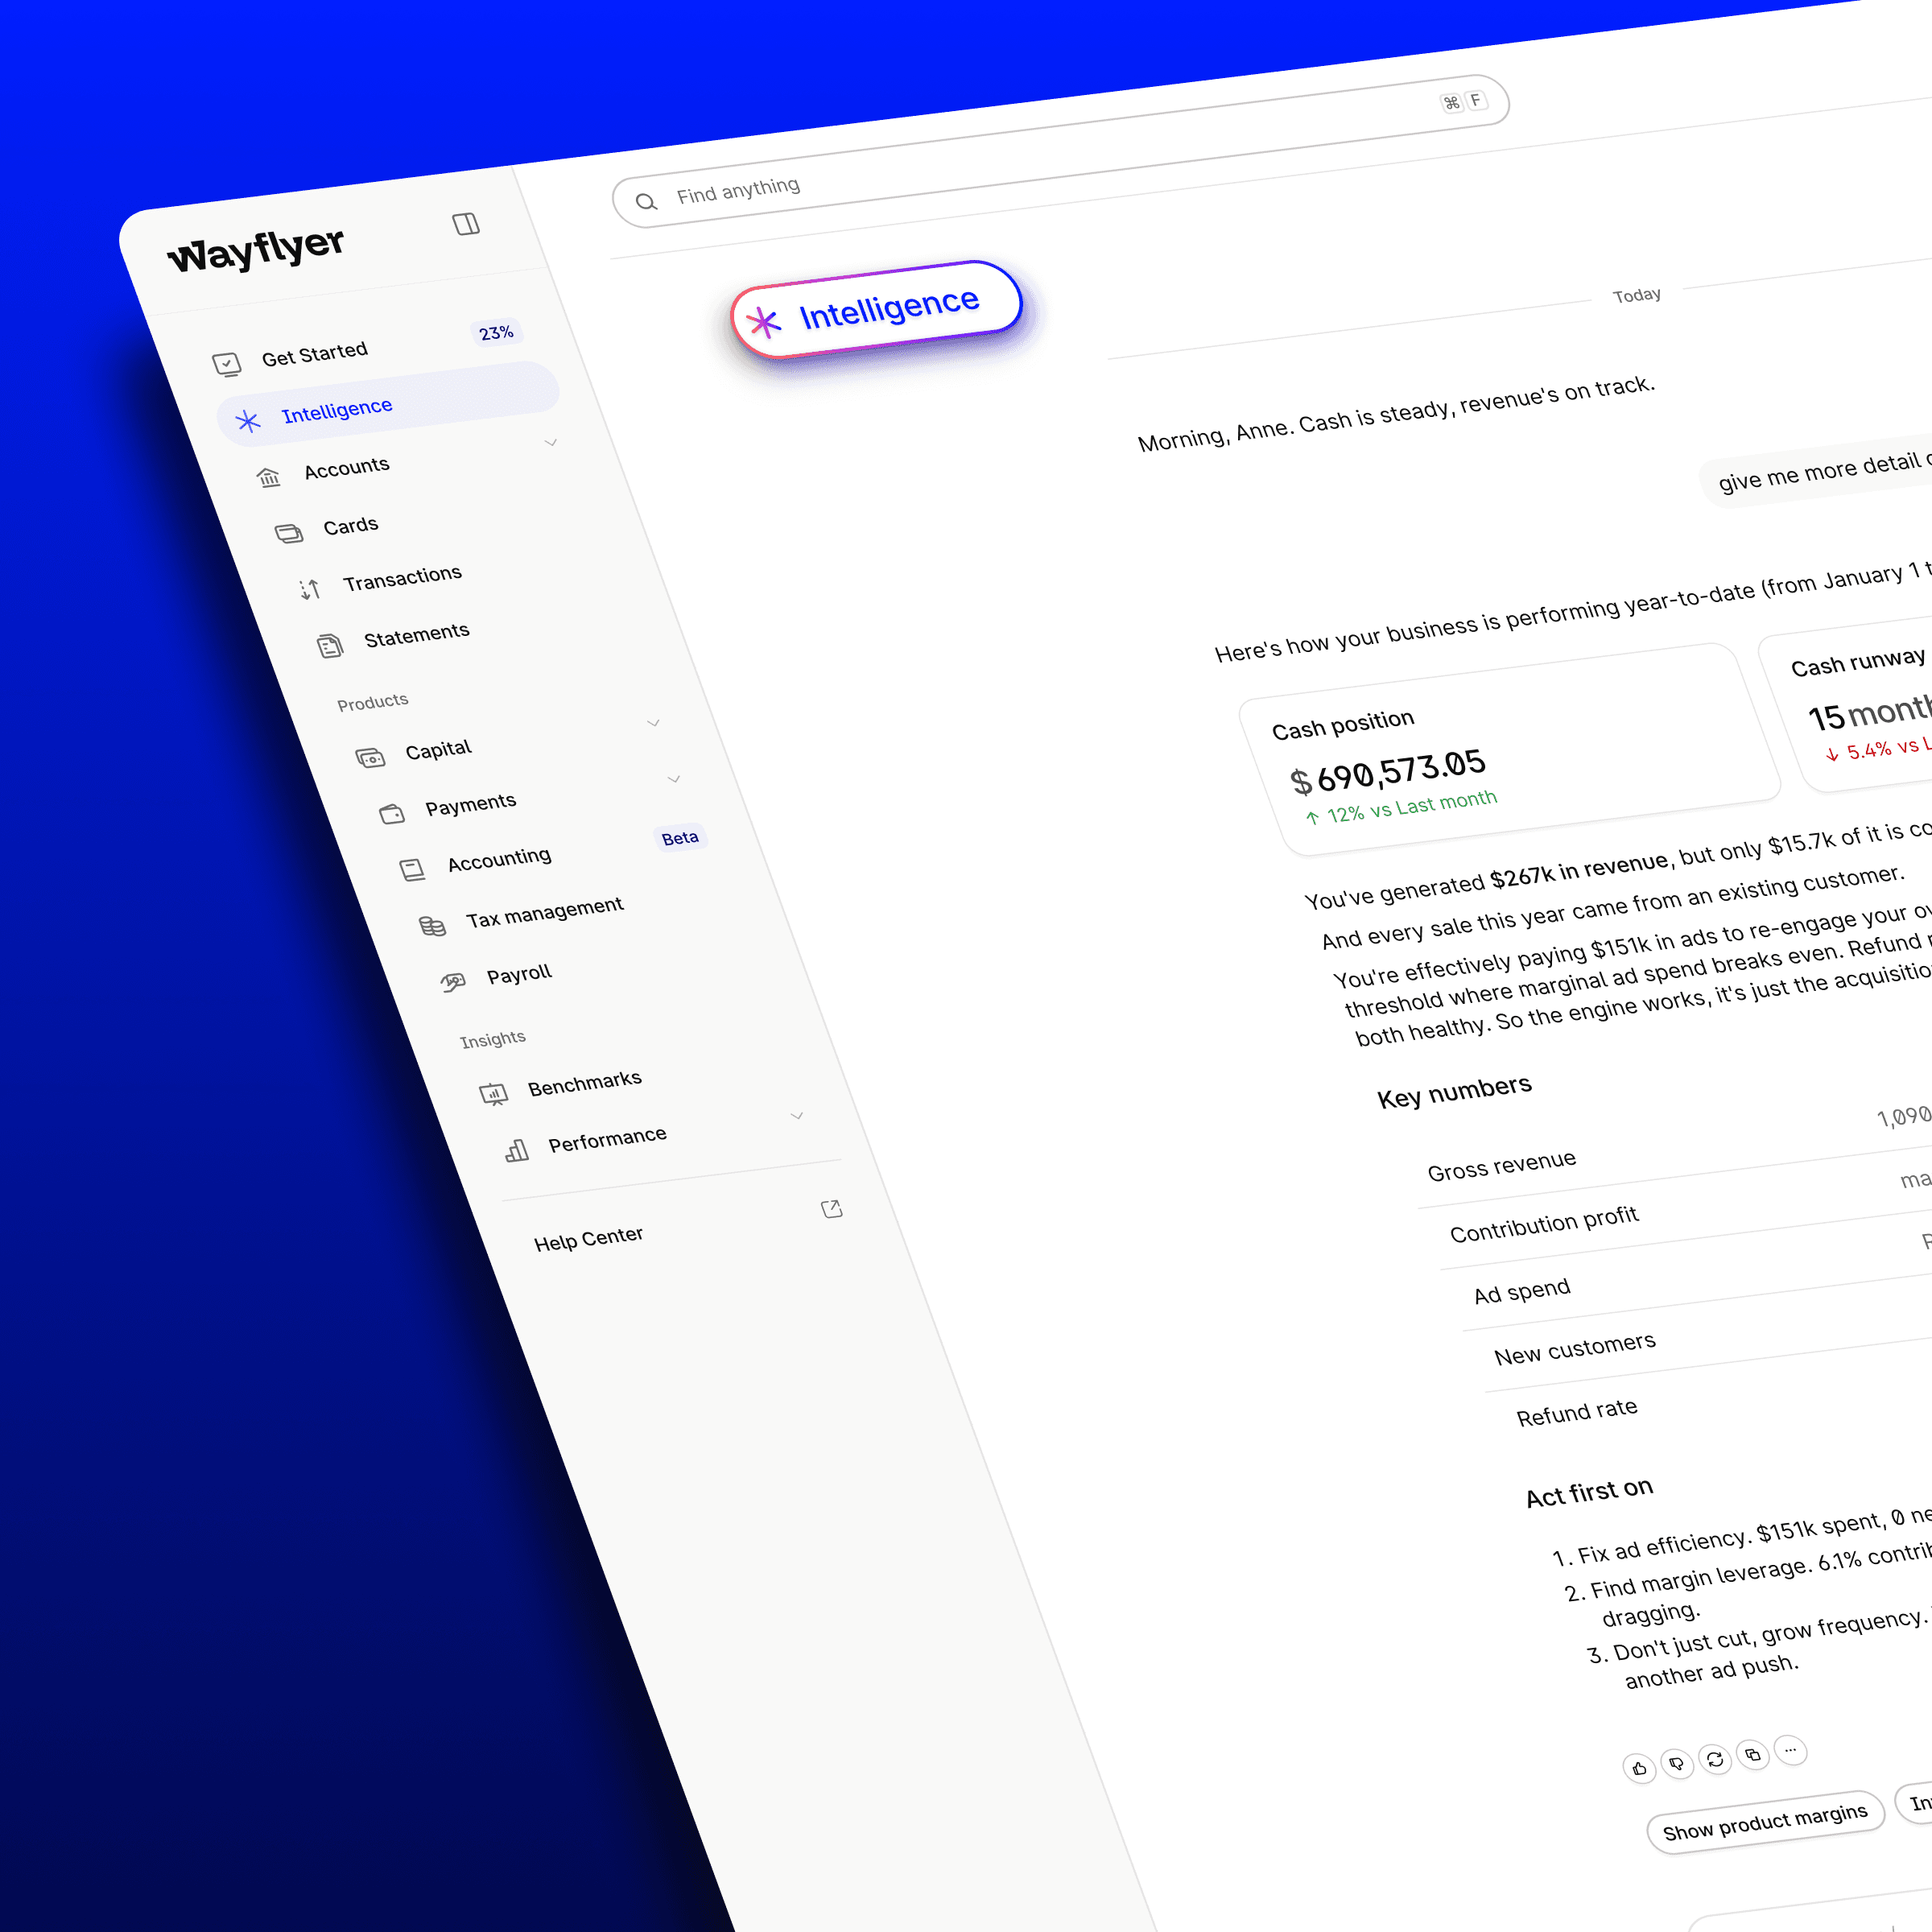
Uncover financial insights with Wayflyer Intelligence.
Go one step further than our Black Friday report card tool. Create your free Wayflyer account, ask your connected data a question, and get actionable responses in seconds.
Keep planning your business
Review
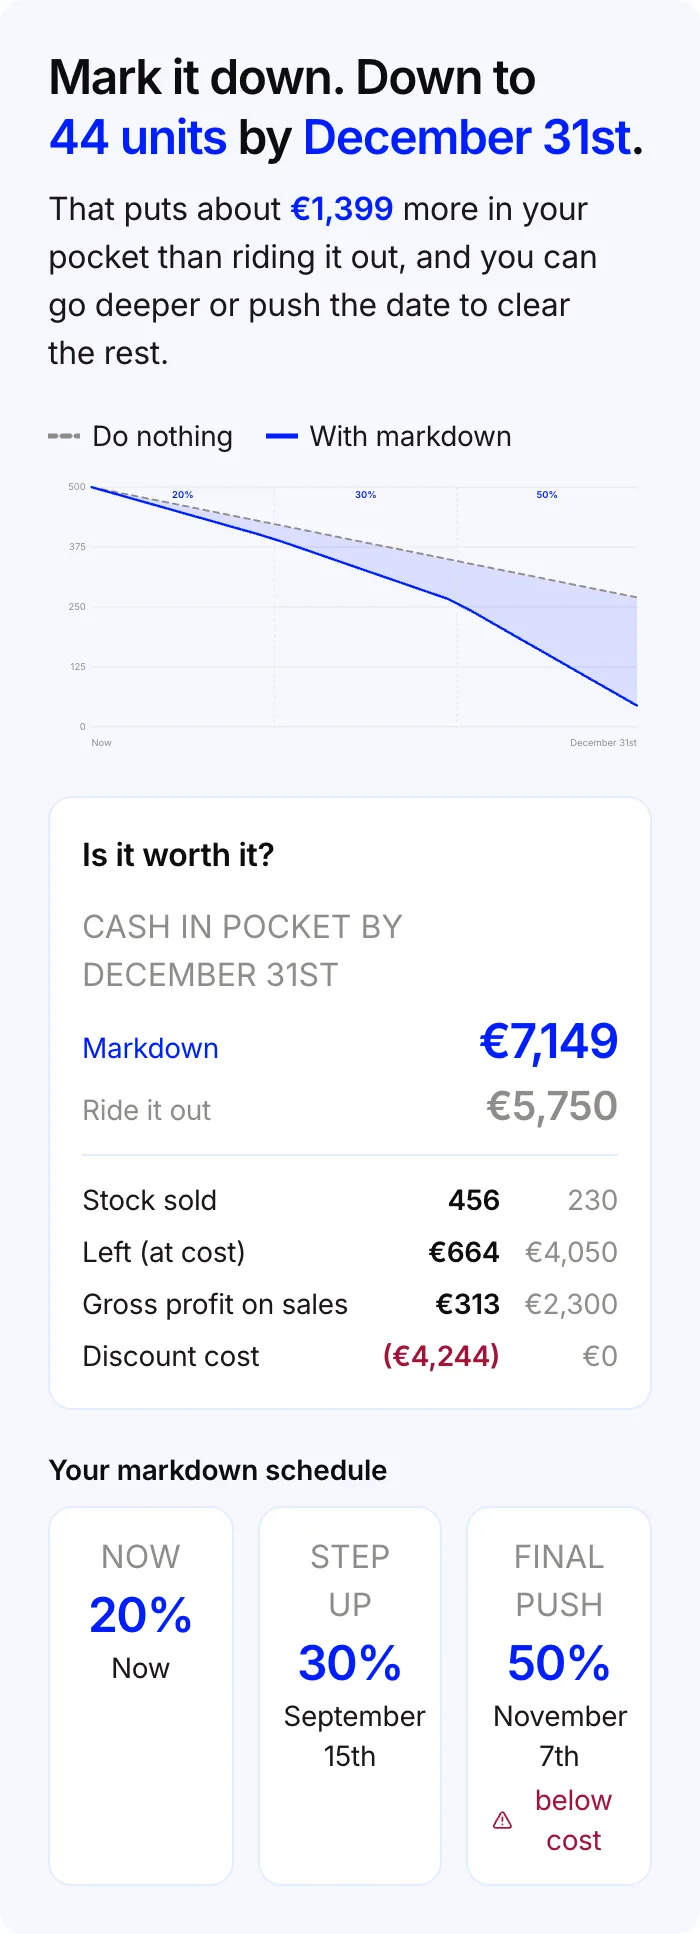
Stuck with stock that didn't sell?
Plan
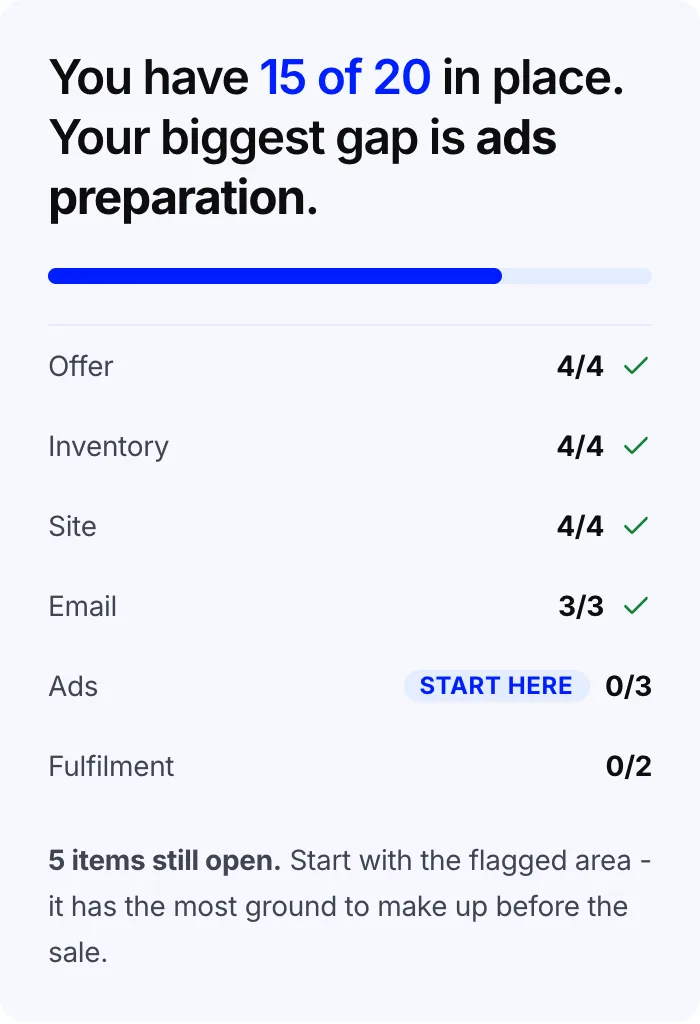
Ready to do better next time?
Fund
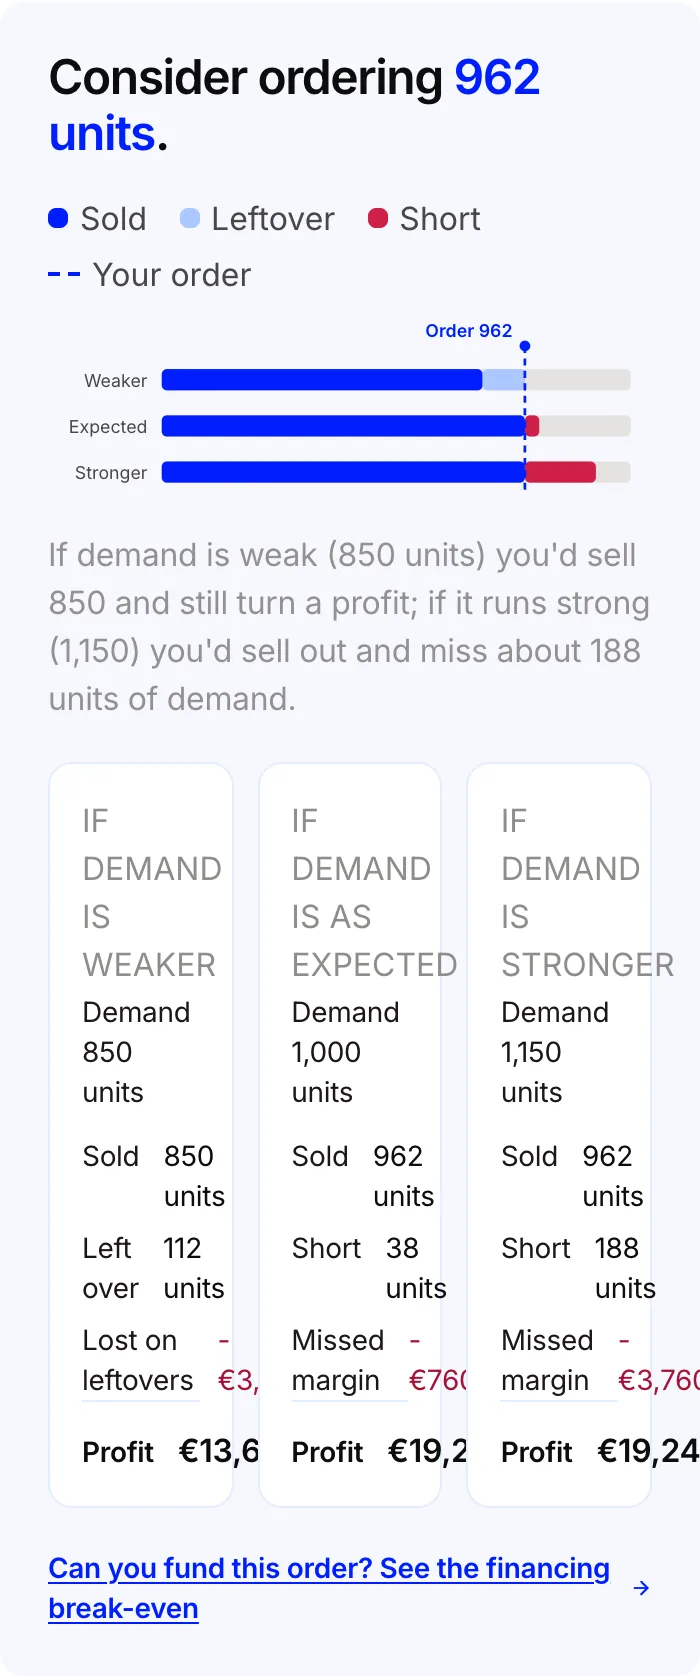
Order smarter next time?
Fund your biggest Black Friday yet
Apply for fundingBlack Friday report card FAQ
It's a way to grade last year's Black Friday weekend on more than just revenue. Enter your revenue, margin, discount depth, ad spend and new-customer share, and the tool grades three things separately: discount discipline, ad efficiency and acquisition quality, then rolls them into one overall grade and flags the single area to fix first.
There isn't one universal number, whatever a flat "aim for 4x" rule might suggest. The ROAS you need to be profitable depends entirely on your margin: a 60% margin brand might be fine at 2x, while a 30% margin brand can lose money at the same ratio. That's why this tool grades your ad spend against your own break-even ROAS rather than a generic benchmark.
Break-even ROAS is the minimum return on ad spend needed just to cover what the ad brought in, given your margin and discount depth. It answers "how much do I need to make per unit of ad spend before I've made any profit at all?" This tool works it out from your contribution margin and discount depth, then compares your actual blended ROAS against it to grade ad efficiency.
Blended ROAS divides all your revenue (including organic and returning-customer sales that would have happened anyway) by your ad spend, rather than only the revenue your ads can be directly credited with. It's the number most brands actually have to hand, so it's what this tool uses, but it means a comfortable-looking ROAS can still hide ads that lost money on their own.
Discount discipline, ad efficiency (if you entered ad spend) and acquisition quality are each graded A to F, then averaged and rounded to a single overall grade. Focus here next time always points at whichever of those graded areas is weakest, since that's the one lever most likely to move your result.
No. Your figures stay in the browser tab. Once you've entered enough to produce a result, we log the grades and percentage inputs (margin, discount depth, new-customer share, returns) for our own product analytics; raw money figures like your revenue and ad spend are never sent.
Check your margin maths for every planned discount with the discount break-even calculator, map your prep back from sale day with the backwards planner, or browse the full Black Friday toolkit.